On the Clusters page you can review your cluster status details, execute cluster actions and add or remove clusters from the Dashboard. (See Figure 6.2, “Populated Cluster Front Page”)
The first tools available to you on the Clusters page are the Collapse/Expand and Simple/Advanced View toggle buttons just below the top navigation bar. (See Figure 6.3, “Cluster Tool Bar”)
Collapse/Expand opens or closes all clusters visible on the page, and the Simple/Advanced View toggle button switches which columns are shown to you.

Below the toolbar you can find the clusters themselves:
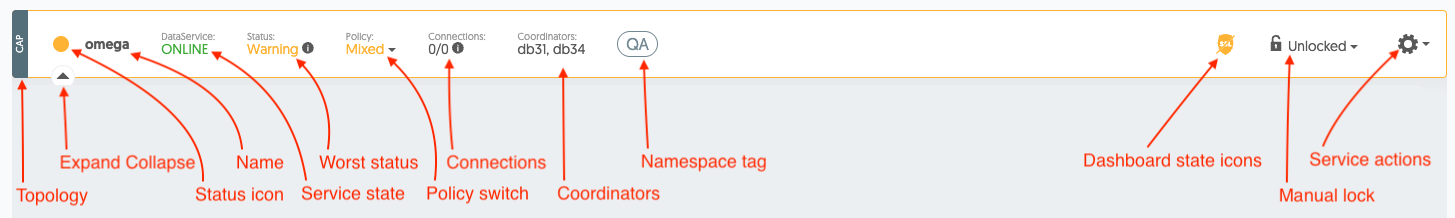
A description of each item is as follows:
Topology label - the same three-letter abbreviations that the front page has (STA, CAP, CAA)
Status icon - colorized based on the worst status of any of the cluster's hosts (green, yellow or red)
Cluster name - clickable link that hides other clusters
Service state* - The state of the cluster's parent service
Status - the Dashboard's calculated status for the cluster based on the status of the worst element. Placing your mouse over the info icon next to this status will give you the details why the cluster was given that status
Policy - shows the current policy of the cluster, and clicking this element allows you to change it. There are three possible states: Automatic, Mixed and Maintenance. For up to date documentation about these states, please refer to the Tungsten Clustering documentation
Connections - Number of connections to the cluster; hover to see connections broken down by host
Coordinator(s) - the Cluster's current coordinator(s)
Namespace label - Clickable link which limits the shown clusters to those clusters with the same namespace label.
Dashboard state icons - These optionally visible elements alert you if there is anything that requires your attention in the connection from the Dashboard to the configured cluster.
Manual Lock - Dropdown which allows you to lock the cluster, which prevents other users of the Dashboard from performing any actions on that cluster while the lock is active. Use this in combination with Maintenance mode to prevent other users from acting on a cluster that you're working on
Action dropdown - The gear icon provides access to a variety of controls for controlling the cluster service. (See Figure 6.5, “Parent Service Actions/Operations”) Note that the content of this dropdown changes based on the type of cluster connected to. You can find more details in Chapter 9, Operations and for additional information about individual operations, please refer to the Tungsten Clustering documentation.
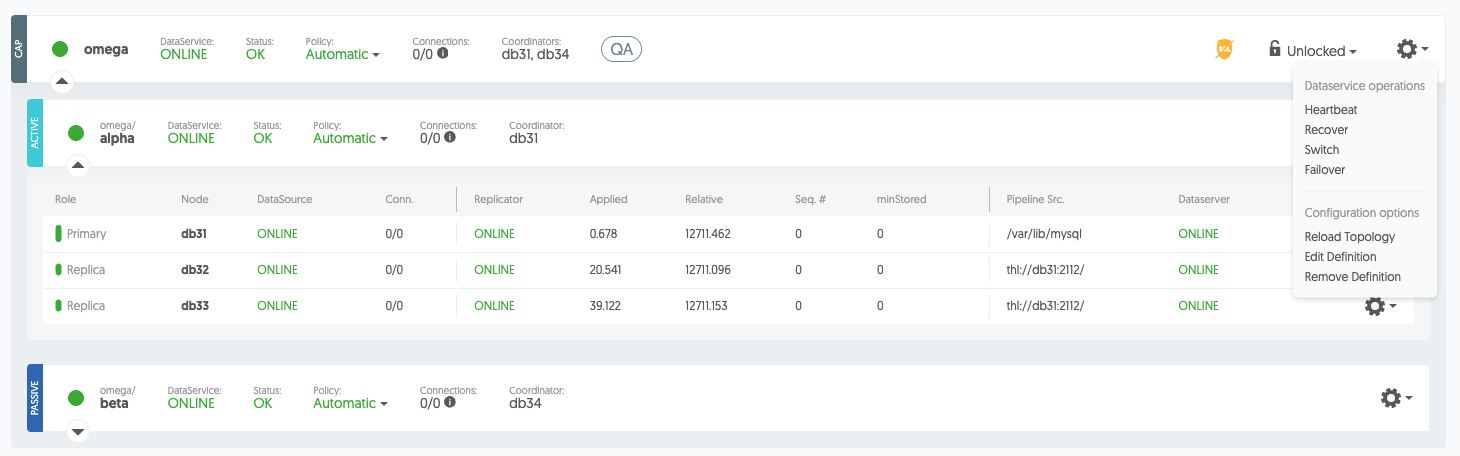
Following the cluster service actions are the Dashboard-specific actions for each service:
Reload topology - Clears cluster data from the Dashboard and fetches the topology from cluster's REST API then re-connects the TCP session with the cluster.
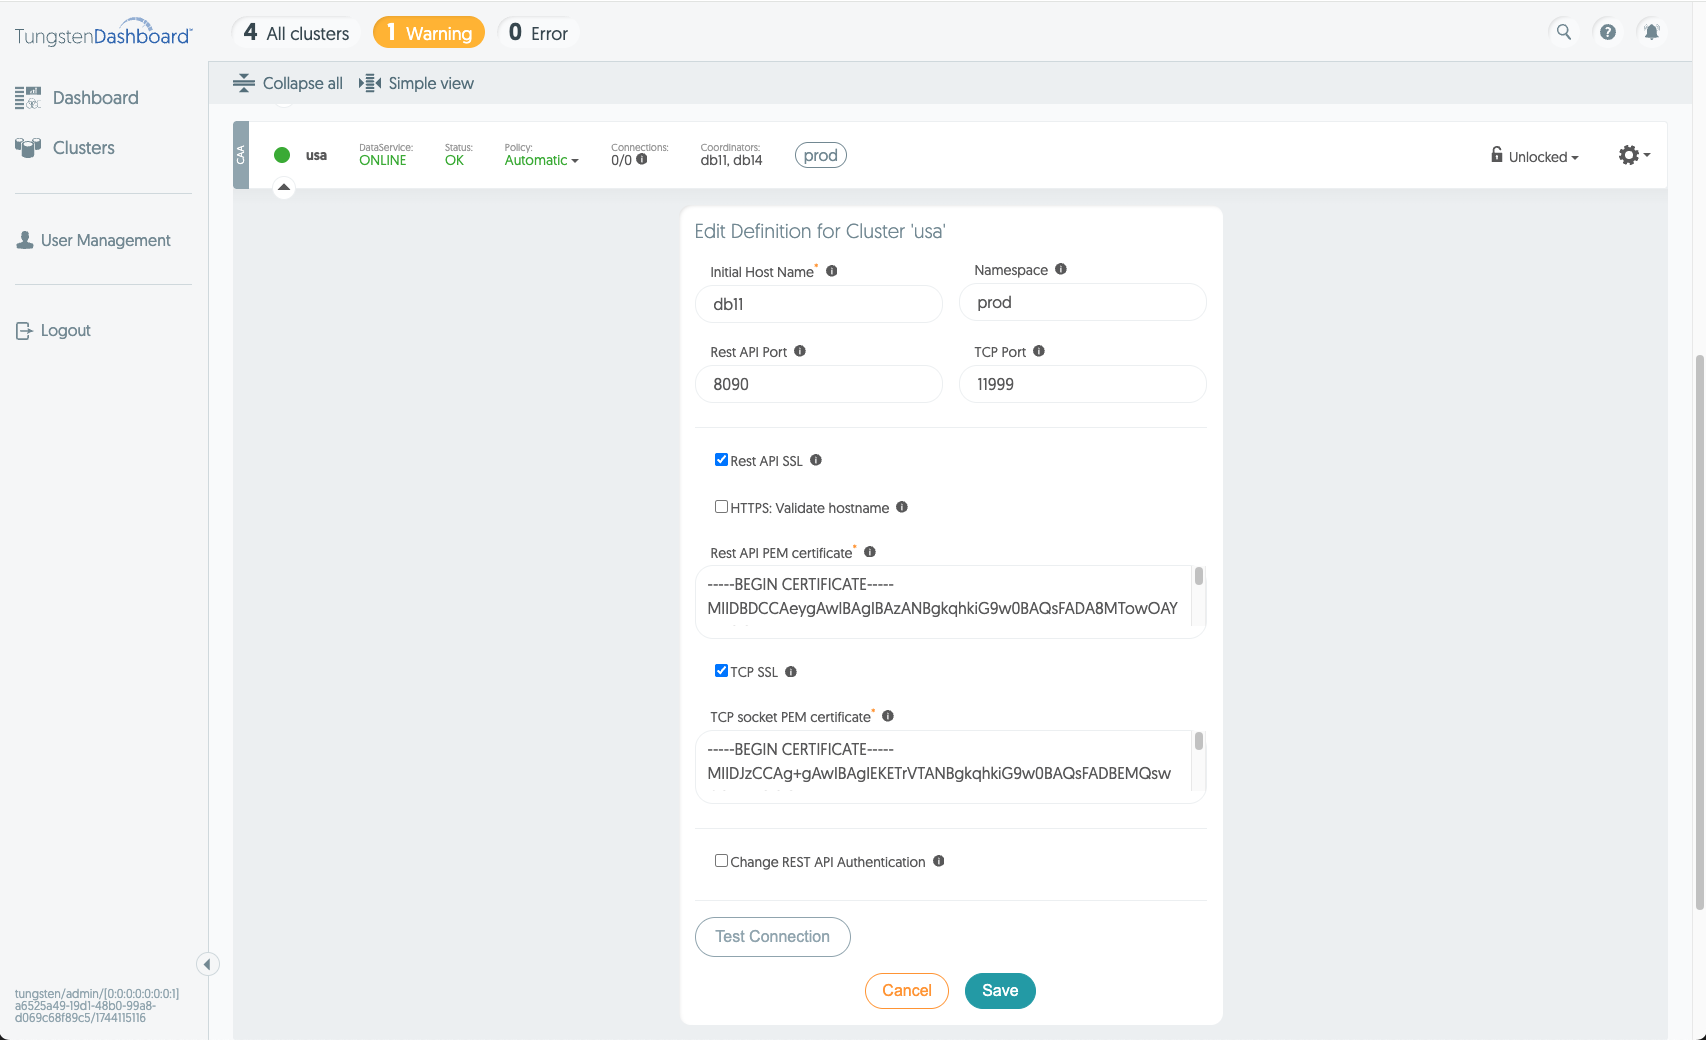
Edit cluster definition - Opens the Edit Cluster form so that you can alter any of the cluster's configured connection details. (See Figure 6.6, “Edit Cluster Form”)
Remove cluster - Deletes the cluster from the Dashboard
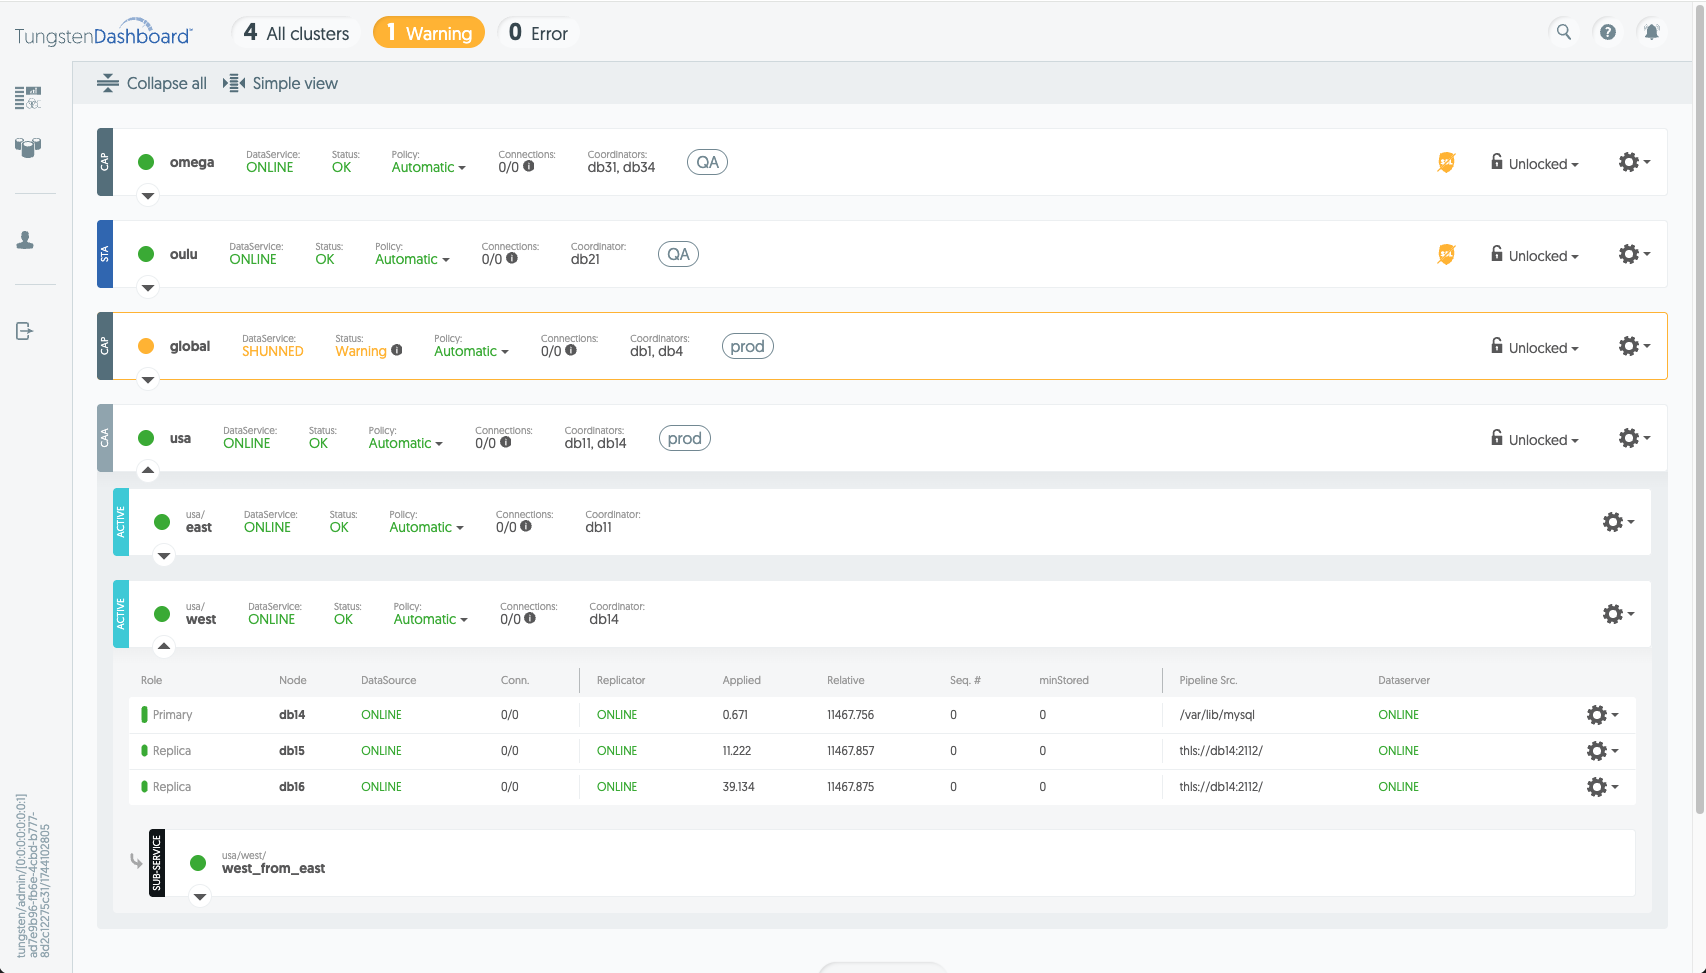
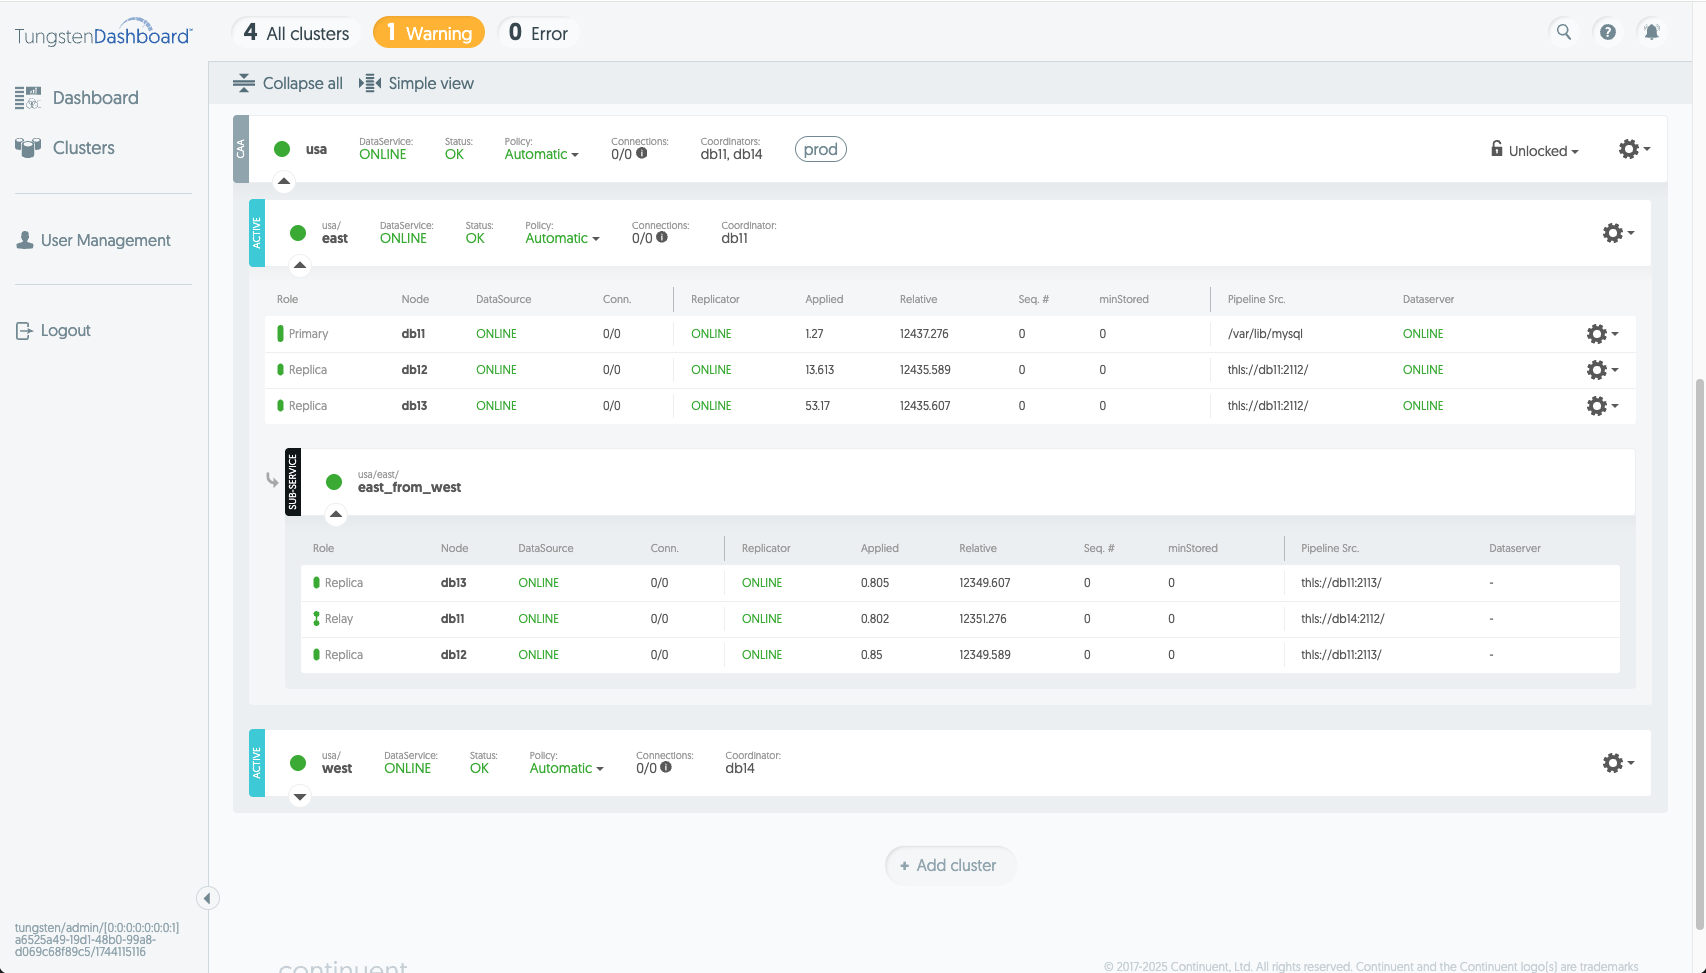
The cluster's host details are displayed as a table. (See Figure 6.7, “Cluster Host Table (CAA)”) It has fields such as:
Role
Name
Datasource status
Connection count
Replicator status
Replicator applied latency
Replicator relative latency
Current Sequence number
Minimum Stored Sequence number
Pipeline Source
Dataserver status
Action dropdown.
Note
Please note that the role of the host affects what data is available in any given row. Refer to Tungsten Cluster documentation for up-to-date information about the data contained in each of these fields.
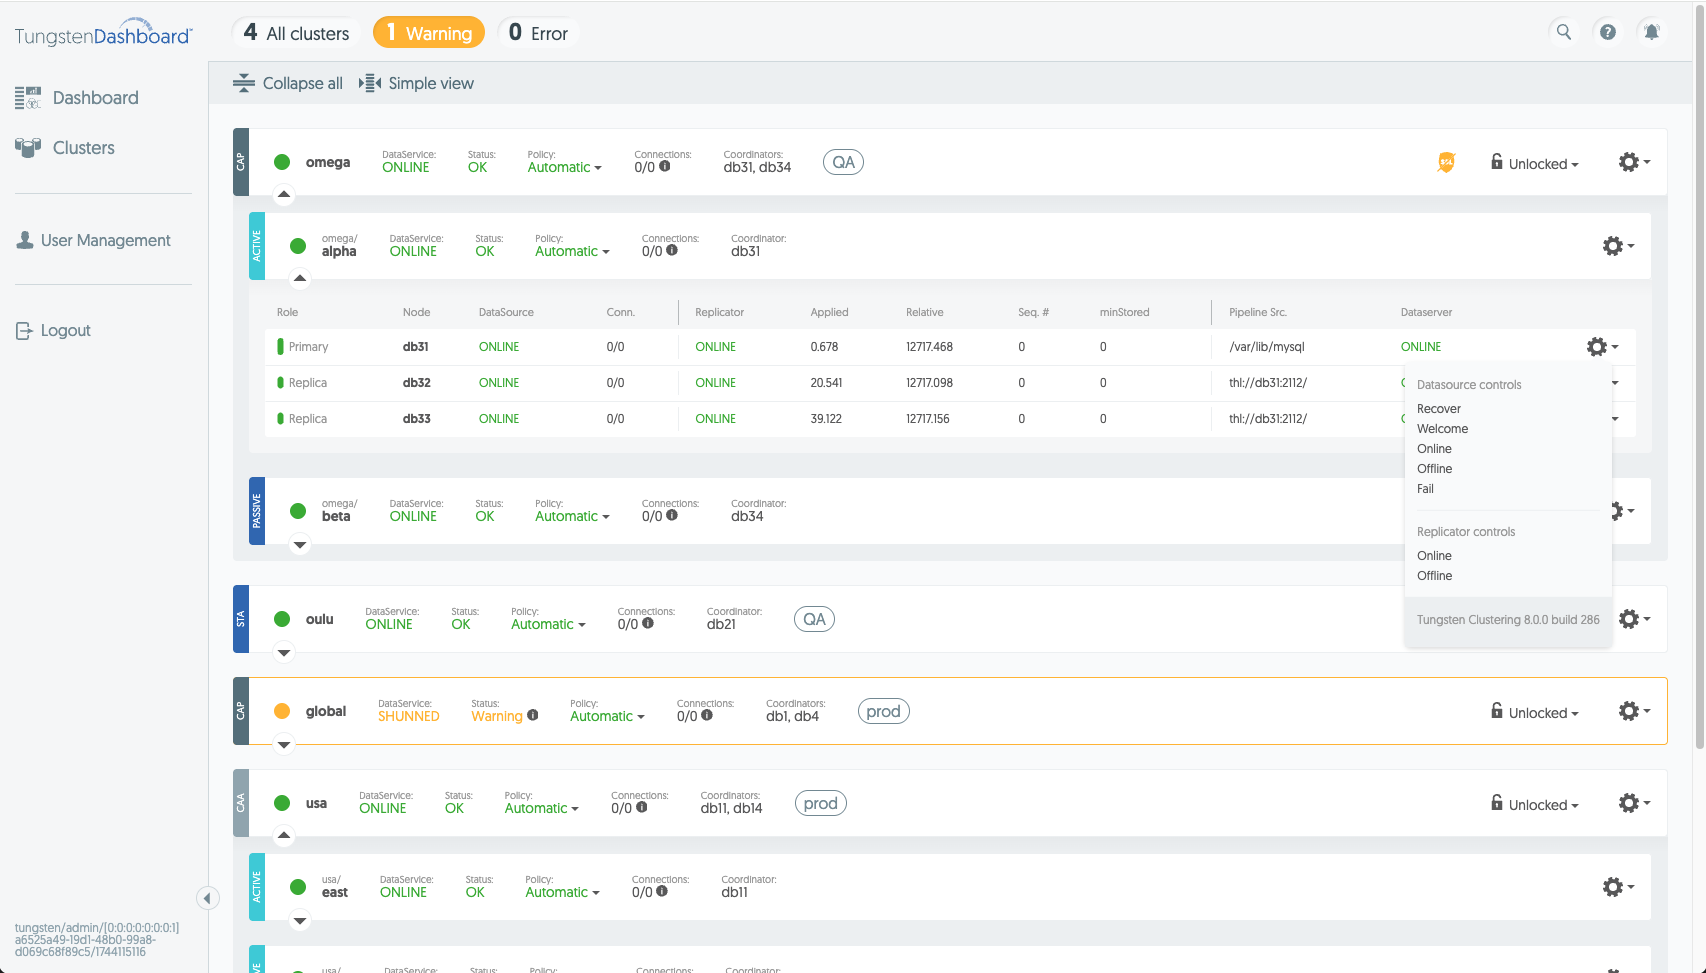
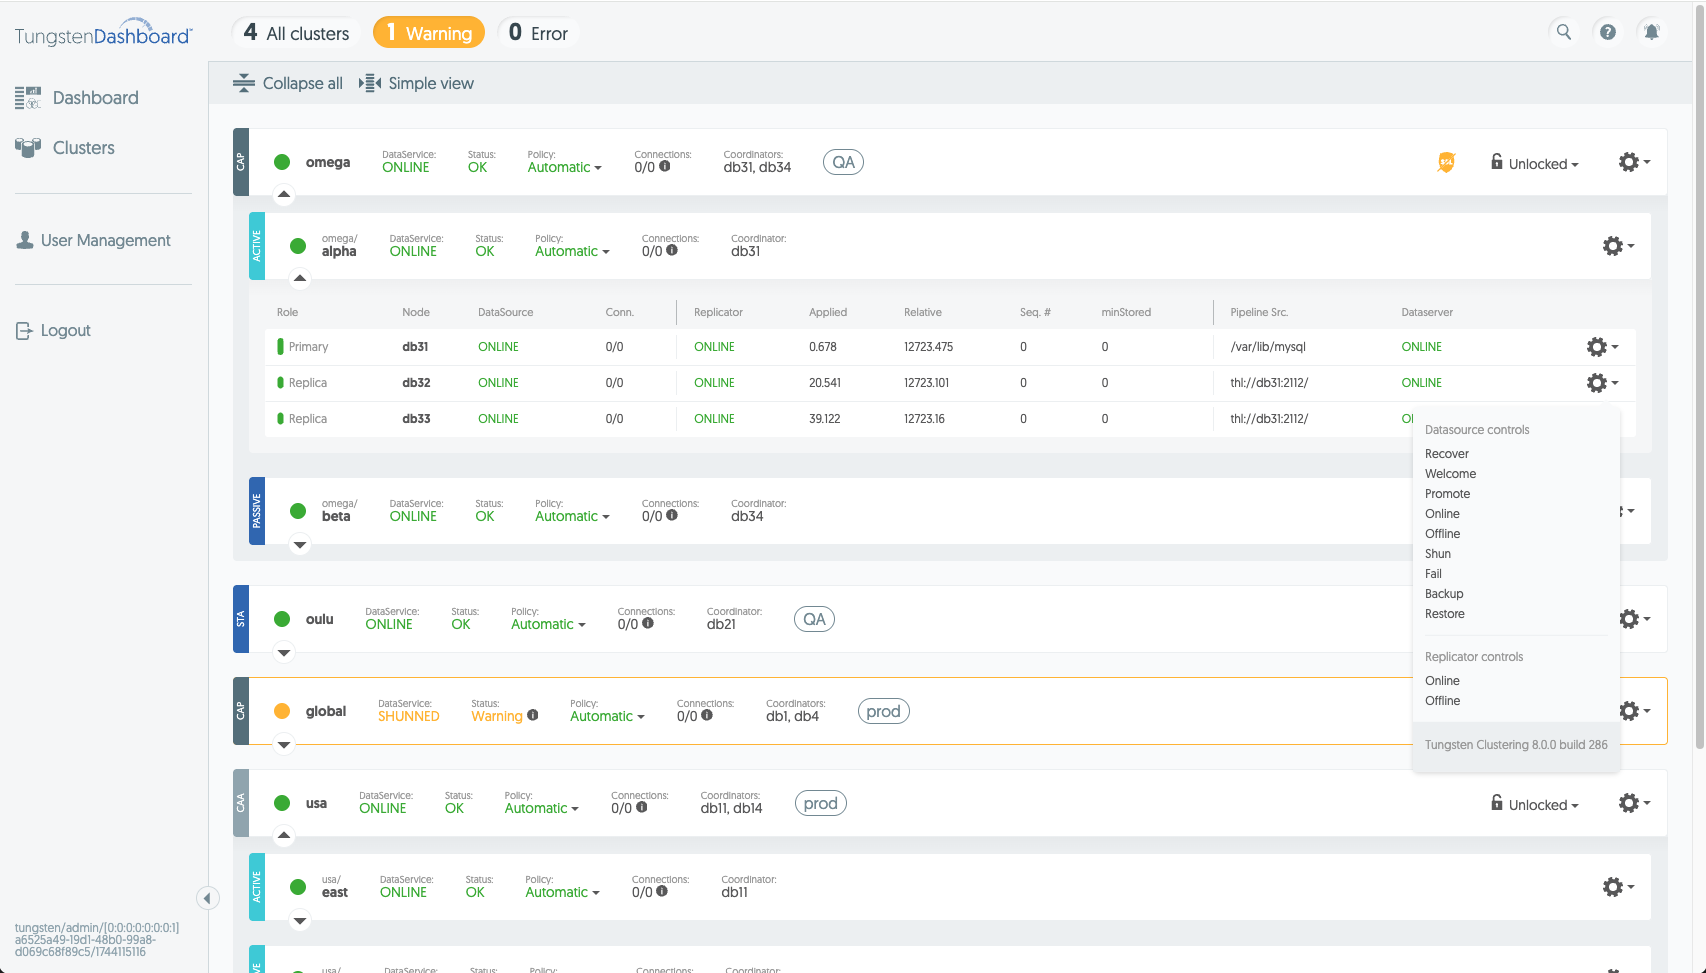
In the host row actions dropdown (See Figure 6.8, “Primary Host Operations” & Figure 6.9, “Replica Host Operations”) you can find a set of operations the Dashboard can post to the cluster's REST API for each of the hosts. Note that the host's Role affects what actions are visible. To see more details about operations see Chapter 9, Operations