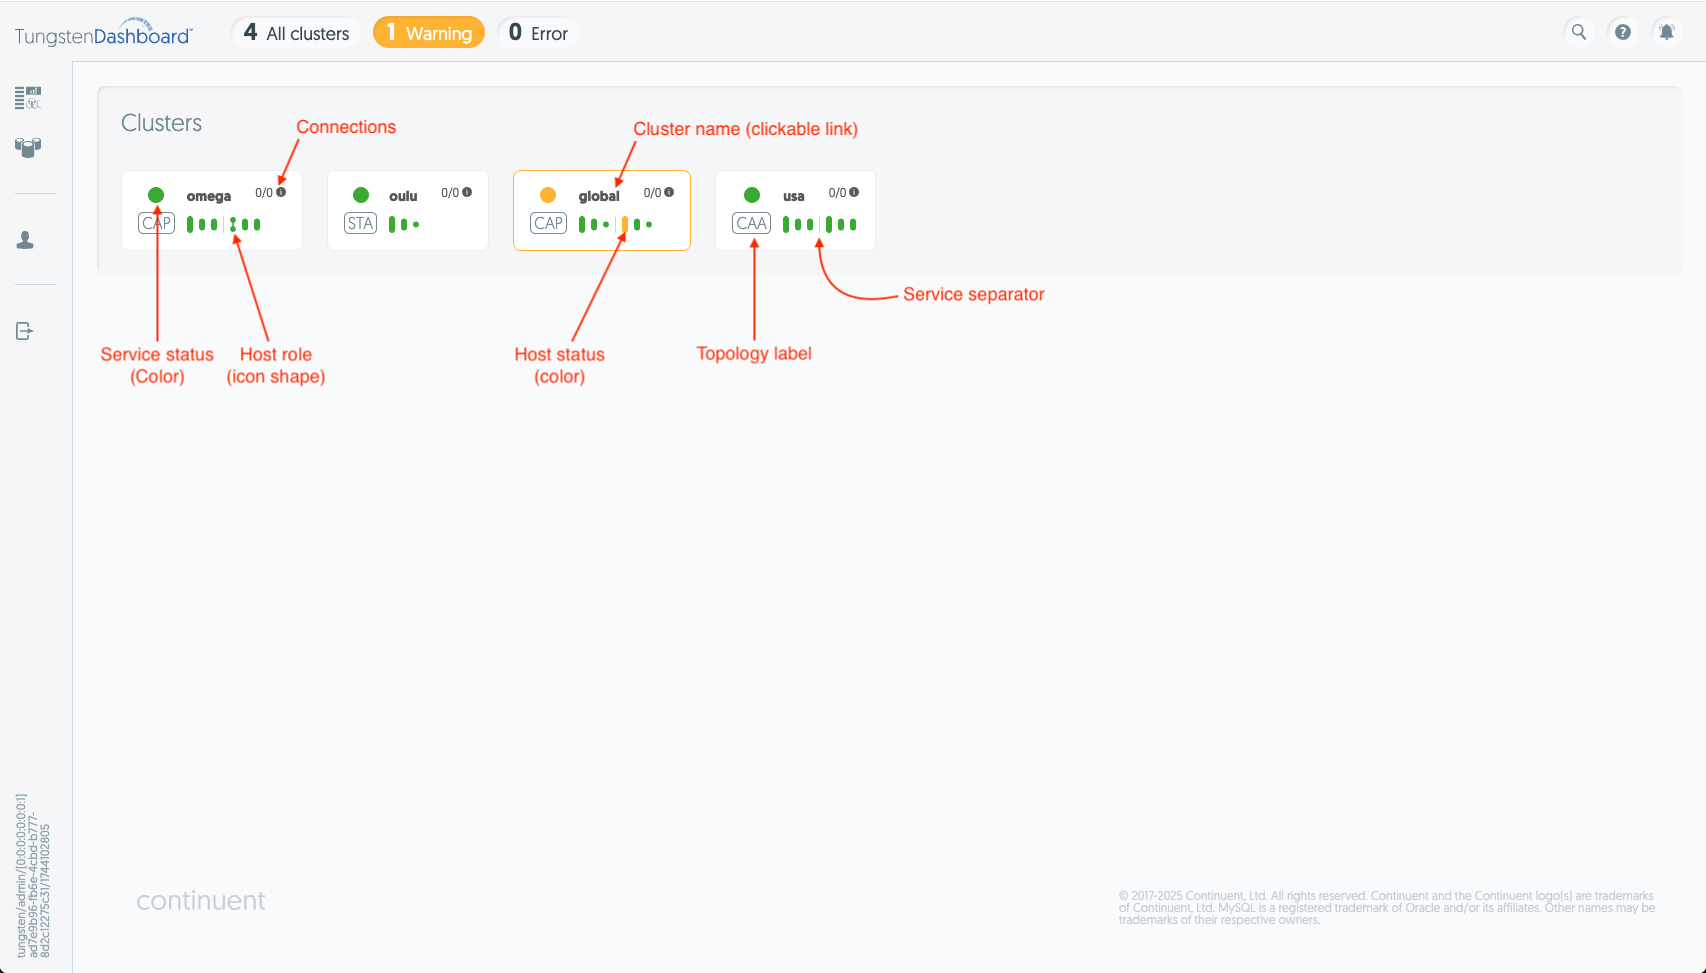
From this page you can find a quick status overview of any of the clusters you have connected the Dashboard to. Clusters are split into small "widgets" on the page. (See Figure 6.1, “Front Page Interface”)
Each widget shows:
Status of the service with in the border and status icon color
Green - ok
Yellow - warning
Red - error
A clickable cluster name that takes you to the Clusters page to see more details about that cluster
The number of connections to each cluster broken down by host
The topology of the cluster:
STA - Standalone
CAP - Composite Active/Passive
CAA - Composite Active/Active (and Composite Dynamic Active/Active)
The role of the nodes for each cluster are indicated by the icon size:
The full-size icon indicates a "Primary" node
The medium-sized icon is a "Replica" node
The small dot is a "Witness" node
Refer to the help overlay of the Dashboard for a break-down of the icon information or Tungsten Cluster documentation for a breakdown of the roles.
Each service for a composite cluster is separated by a small vertical line in this widget.